Using data to change behaviours
Data’s a vital part of what we do for you. It tells you what’s happening on your site between people and vehicles. You can see where, when, how often, and who gets too close to mobile plant or in the bin lift danger zone.
And customers tell us the dashboard and weekly reports immediately show you the key information you need, so you're not overloaded with data.

Know what’s happening and act on it
Being informed means you can act and make long lasting changes for site and transport safety. We designed our dashboard in Microsoft Power BI for simplicity.
You get to the key information on your risks straight away. But for a more detailed analysis you can slice and dice the data and even delve into each exclusion/danger zone breach.
The data is presented in context. You can see what proportion of your site exclusion zone breaches are caused by certain tags or vehicles. And with the heat map you can pinpoint where you may have areas of concern.
Weekly insights direct to your inbox
No time to look at the dashboard? No problem. We send you a weekly report with your highest risks for the previous week. Landing in your inbox on a Monday morning you’ll get:
- Summary of your breaches and unacknowledged breaches
- Count of active tags and vehicles
- Highest risk vehicle
- Highest risk tag
- Highest risk time of day and day of the week
- Highest risk road (for RCV Smart Loader)
- The difference from the previous week - have you improved
This gives you key areas to focus on right away for improvements to your site safety.

“When we first installed the system at Avonmouth, we made a 97% reduction in zone breaches in just three months using the data. It gave us visibility of what was happening on the ground, and we made long-lasting site improvements, including redesigning pedestrian routes, reducing access points and further improving physical barriers. We also increased awareness and changed behaviour amongst the workforce on-site."
Paul Marsden
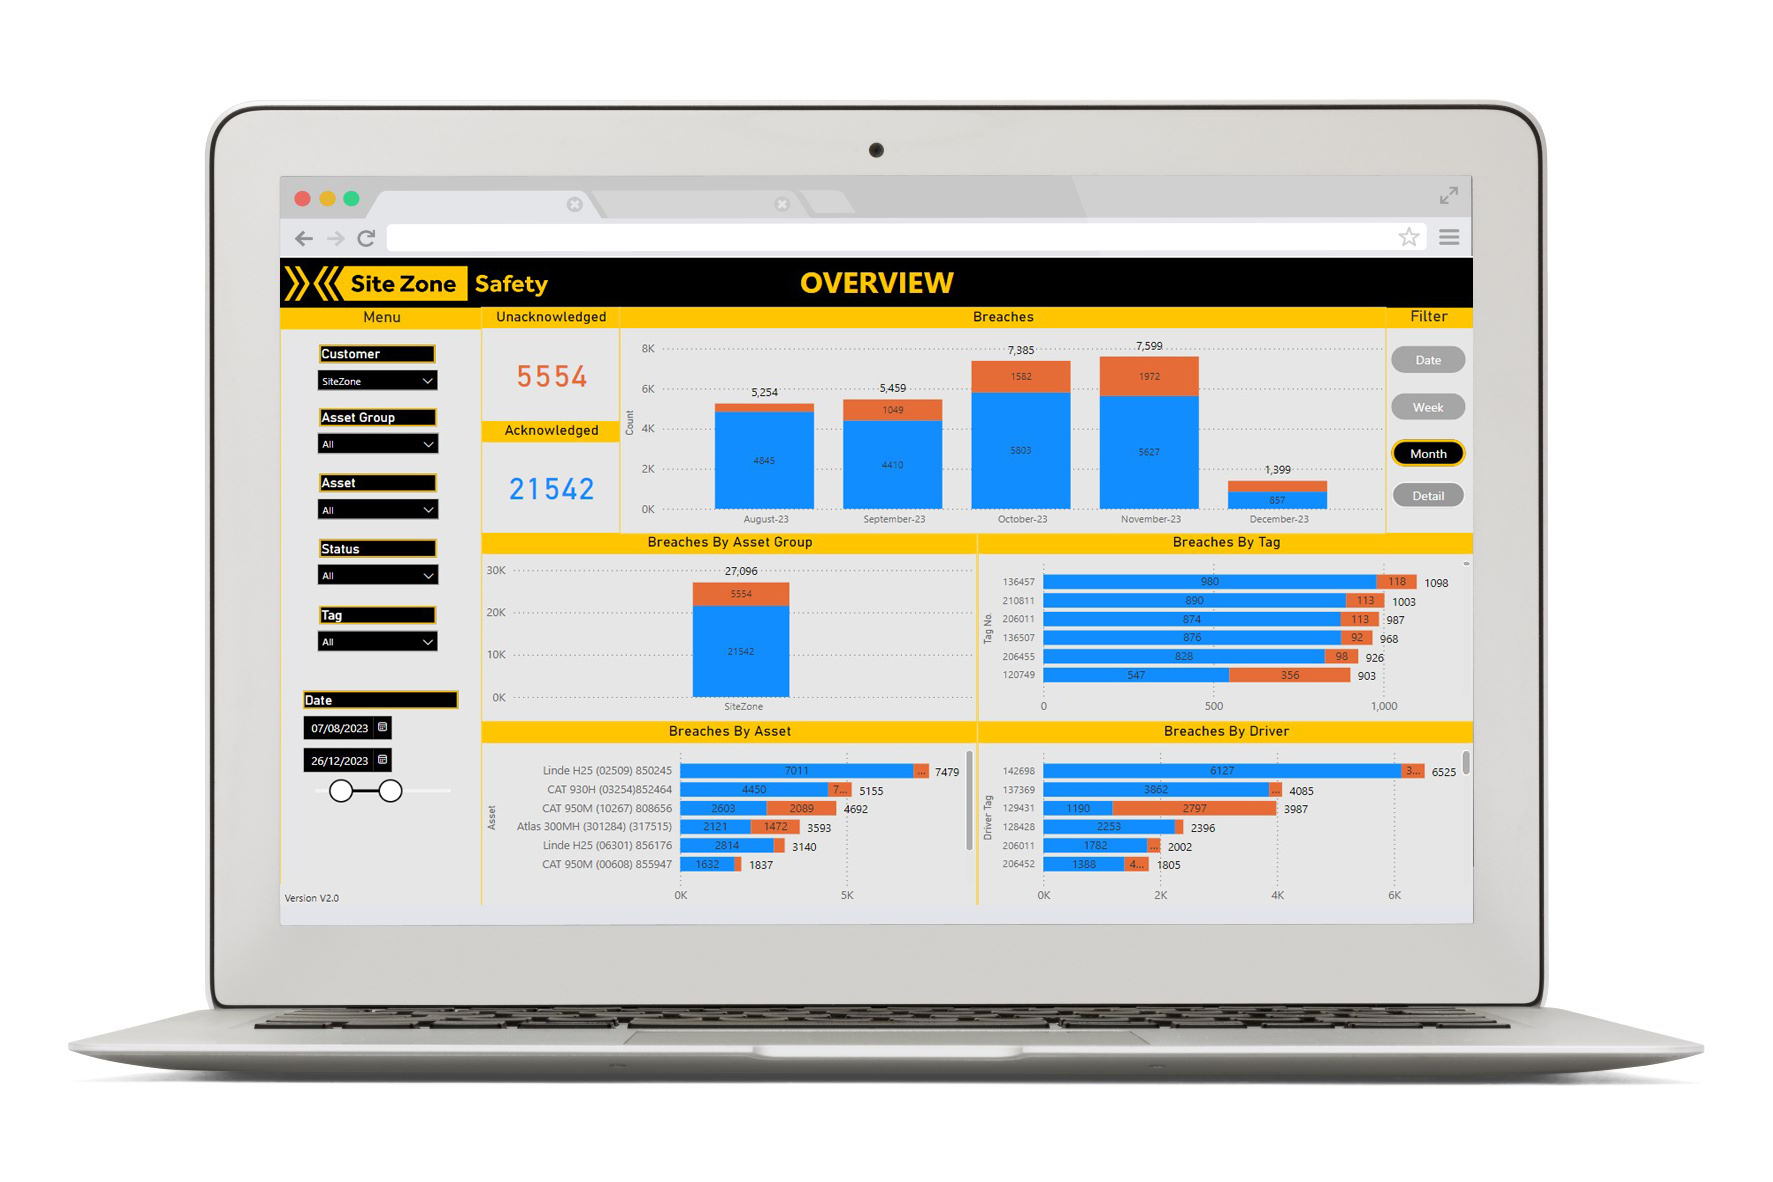
Director of Health and Safety | SUEZ

"The analytical data platform is an exceptional risk management tool from which improvements can be tracked. The information contained within the platform is anonymised (based on tag ID) and supported development of a strong, positive, safety culture changing behaviours to make a safer site."
Chris Beddoes
Business Manager | Stop 'N' Go

Your data’s in safe hands
Data security is important to you, and us. We hold no personal data on the platform; we only report on IDs and you control your personal data (you can keep a log of who has which tag ID).
To give you further peace of mind we’re Cyber Essentials Plus Certified. This government backed scheme means we’ve been externally tested and certified, proving to you we take cyber security seriously. We have systems in place in our infrastructure to protect against cyber threats, including multi-factor authentications, strict admin polices, and much more.
Every 11 minutes: the hidden risk facing RCV loaders
The data from our RCV Smart Loader in use on collection rounds for the last two years has shown that a loader enters the bin danger zone every 11 minutes. Tuesdays see more danger zone entries than any other day and 7am is the time of day with most entries into danger zone.
But behaviour changes through the shift - as loaders correct their loading technique - reduces entries into the bin danger zone by 75% in a single round.
Alongside this you can start to see which roads and which types of collections result in more entries into the bin danger zone.
This information helps you plan routes, organise shift patterns, and ensure loaders are correctly trained.